Introduction
On 16 April 2016, an earthquake of magnitude 7.8 on the Richter scale affected the Ecuadorian coast. Its epicentre was in the province of Manabí and had a focal depth of 20 km. The earthquake killed more than 700 people, injured 30 000 people and completely destroyed towns such as Pedernales and surrounding rural areas1.
Food insecurity is defined as ‘the limited or uncertain availability of nutritionally adequate and safe foods; or the limited and uncertain capacity to acquire adequate food in socially acceptable ways’2. Once the emergency stage of a natural disaster has ended in a general manner, food insecurity is usually one of the food problems that has the greatest impact on populations affected by the disaster, especially among the poorest groups, because it increases risks of undernutrition and disease in the population3-5. These problems arise because natural disasters usually have many lasting consequences that affect food security, such as water pollution and poor sanitation. Disasters also increase economic problems due to the destruction of rural infrastructure and agriculture, such as loss of crops and harvests and the deaths of animals.3,6-8
Only one relevant report was written in Ecuador before the event. In 2011, the study found that the problem of food insecurity in Ecuador was specifically related to people’s ability to purchase food, which affects the quality of life. Thus it was recorded that 8.7% of Ecuadorian households did not have the means to access a sufficient amount of food to cover their minimum needs, with 76% of cases occurring in rural areas of the country. The Amazon region had the highest prevalence of food insecurity in households (27.8%), whereas provinces such as Manabí, Esmeraldas, Loja, Cotopaxi and Imbabura recorded values between 10.4% and 16.4%9 and showed no difference between rural and urban areas.
It is understood that the problem of food insecurity is also caused by economic constraints, such as lack of education. Moreover, at the national level, the probability of a family not being able to access a minimum amount of food increases by 8% if the head of the household is a woman and if there is a greater number of members per family. These findings are linked to the unequal distribution of food within the home and gender inequality. Likewise, a higher number of children under 5 years old generates pressure on household resources, increasing the risk of a family suffering from food insecurity. This situation is more evident in rural areas, where an additional infant increases the possibility that the household lacks access to a minimum amount of food by 2.6%9,10. All these factors contribute to increasing levels of food insecurity after a natural disaster, as evidenced in Nepal after the earthquake in 2015, where rural areas and families headed by women were the most affected5,11.
Given the need to understand how earthquakes affect household food security in rural areas, this study evaluated the dietary diversity and prevalence of food insecurity in vulnerable families in the community of La Punta, which was affected by the earthquake.
Methods
Study population and design
This was a cross-sectional observational study, which included a sample of 28 households living in the La Punta rural community, located 40 minutes by road from Pedernales (province of Manabí), the epicentre of the earthquake on 16 April 2016 (see Figure 1). The study was carried out 4 months after the natural disaster, once the emergency stage was over. Prior to the study, it was necessary to diagnose the community based on a sociodemographic survey that determined the socio-economic status of each households (n=44 heads of household, who represent approximately 34% of the total number of households in the community). The study was carried out using non-probabilistic sampling for convenience, where families that met the following inclusion criteria participated: a family nucleus with more than five members including at least two children under 10 years old or a teenager or an adult over 65 years old; the economic income depends on the work of only one member of the family who is engaged in work such as agriculture and fishing; and a home lacking a bathroom, sewerage or safe drinking water. For this study, the analysis also focused on households with children under 5 years of age (n=14 families).
Nutritional status of the population
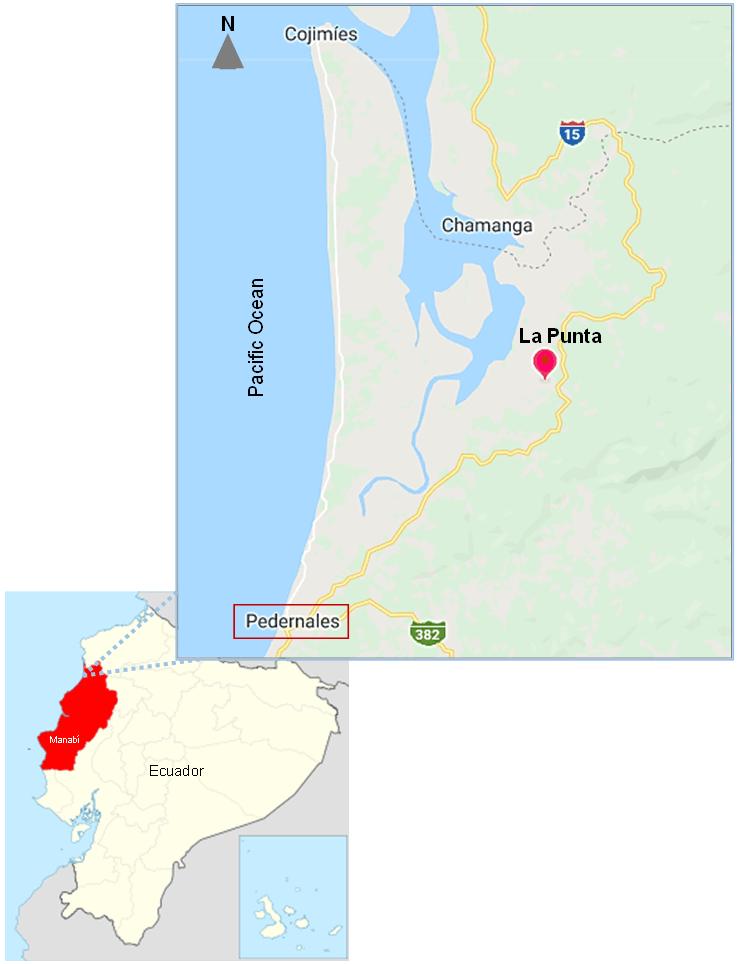 Figure 1: Geographic location of the rural community, La Punta.
In order to determine the participants’ nutritional status, the following anthropometric data were acquired. In children under 2 years old, weight (Seca paediatric scale, 354±10 g), height (Seca infantometer 417±1 mm) and head circumference (SECA anthropometric tape, 201±1 mm) were measured. In children over 2 years old, weight (Seca digital scale, 813±100 g), height (Seca stadiometer, 213±1 mm) and waist circumference (Seca anthropometric tape, 201±1 mm) were measured.
In mothers, nutritional status was estimated using body mass index (BMI) and the cut-off points established by WHO12. In addition, waist circumferences were analysed as an indicator of cardiovascular risk according to the cut-off points established for South America by the International Diabetes Federation13.
In children, weight, length or height, BMI, and head circumference measurements were ultimately converted into weight-for-age Z-scores (WAZ), length-for-age Z-scores (LAZ), height-for-age Z-scores (HAZ), BMI-for-age Z-scores (BMIZ) and head-circumference-for-age Z-scores (HCAZ) (standard deviation (SD) scores), according to World Health Organization (WHO) child growth standards14.
Dietary diversity
Household dietary diversity was assessed with the Household Dietary Diversity Score (HDDS) to establish each household’s access to different types of food15. Prior to applying the instrument, an adapted pilot test was carried out with food from the area.
The HDDS is a continuous score, which measures the consumption of 16 food groups within the past 24 hours: (i) cereals, (ii) roots and white tubers, (iii) roots and tubers rich in vitamin A, (iv) green vegetables, (v) other vegetables, (vi) fruit rich in vitamin A, (vii) other fruit, (viii) offal, (ix) meat and poultry, (x) eggs, (xi) fish and seafood, (xii) legumes/nuts, (xiii) milk and dairy products, (xiv) oil/fats, (xv) sugar/honey, and (xvi) miscellaneous.
To estimate the consumption of vitamin A, two elements were taken into account: foods of animal origin and foods of vegetable origin. For the latter group, foods were considered to be a source of vitamin A if they had >120 retinol equivalents/100 g of product. For the estimation of iron consumption, foods of animal origin were taken into account, such as meat products (haem iron), and foods of vegetable origin, such as green leafy vegetables (non-haem iron)15.
Household food insecurity according to access to food
To determine the level of food insecurity in the population, an adaptation of the Latin American and Caribbean Scale of Food Security used in Colombia was applied. The survey consists of 14 specific questions that identify the household’s main problems in terms of access to food, classifying households with food security or mild, moderate or severe insecurity16,17.
Statistical analyses
Statistical analyses were performed using the Statistical Package for the Social Sciences v22 (SPSS Inc.; http://www.spss.com). The Shapiro–Wilk test was used to study the normal distribution of the data, and non-normally distributed data were natural log-transformed.
Descriptive statistics were used to summarise background characteristics of the study population, reporting mean and SD for continuous data and proportions for categorical variables. The χ2 test was applied to analyse the independence of qualitative variables, and ANOVA with Scheffe post-hoc test used to analyse the difference between nutritional status groups.
Ethics approval
This study was approved by the Ethics Committee of the Universidad San Francisco de Quito (code 2016-109IN) and respects the fundamentals of the Declaration of Helsinki. Prior to the study, informed consent was obtained from the head of the household of the participating families and also from the children who participated voluntarily.
Results
Characteristics of the population
La Punta is surrounded by the Beche River, which is 32.4 km long and a micro-basin of the Cojimíes River. It has a dry, warm climate in summer (between June and November), and a warm, rainy season (between December and May), with an average annual rainfall of 1113 mm (Fig1). Due to its proximity to the sea and to the eradication of mangroves by shrimp farming and rising sea levels, all of the land where the community is found comprises a fragile ecosystem, which is not very fertile for agricultural production. In summer, the low levels of water in the basins and reservoirs make it hard for the population to access running water.
The community does not have a health centre for primary care and has only a basic general education school (lacking the final two baccalaureate years). Neither does it have basic services such as piped water, sewerage, waste collection and bathrooms with running water, so families have to bathe and wash their clothes in the river near the community, which is characterised by low water flows. Approximately 16% of the families urinated or defecated outside and the remaining families used latrines. For food preparation, 50% used water brought up from the river, 39% used bottled, 4% used tanker water and 7% used rainwater.
Families are numerous: more than 60% had 5–10 members, a percentage that had remained unchanged despite the earthquake. About 40% of households had 4–8 children under 10 years old, 54% had children under 5 years old, 61% hadchildren between 5 and 10 years, and 15% of households had adults over 65 years. The prevalence of pregnancies was low (6.8%). At the time of the survey, 59% of the families lived in the same homes as they had before the earthquake, despite having suffered damage, while 31% lived in makeshift homes next to the destroyed houses.
Table 1 shows the characteristics of the population under study (28 families). The data for the mothers or women responsible for the household and children under 5 years old are reported. In all cases, the woman was responsible for feeding the household.
Table 1: Population characteristics according to the mothers’ nutritional status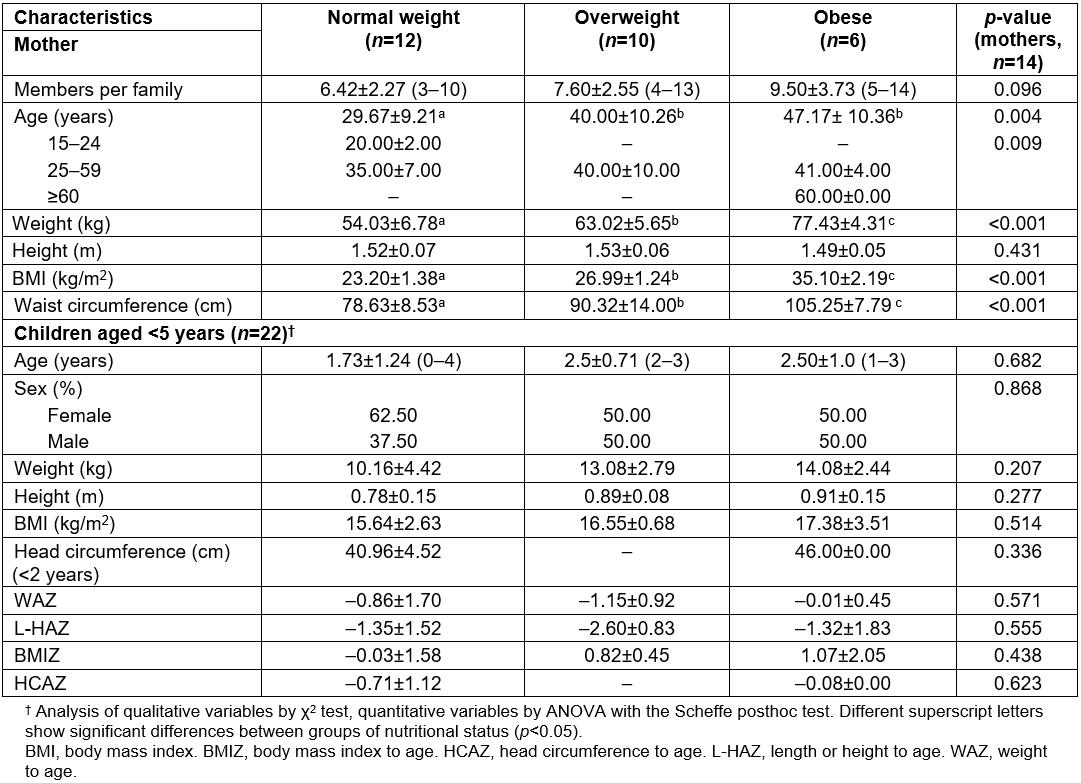
The age range of mothers was identified as 18–60 years old (37±11.8 years), with an average height of 1.51±0.06 m and an average weight of 62.25±10.6 kg. More than half the mothers were overweight or obese (57.14%). All women over 60 years old were obese; the older the women were, the higher the prevalence of obesity (p=0.009).
On average, households had seven members per family; however, that average increased to nine members where the mother’s BMI indicated obesity (p=0.096). In addition, it was observed that 79% (n=22) of the women were at cardiometabolic risk given their waist circumferences, and only 21% were not at risk and were of healthy weights.
Of the total of families that were part of the study, 14 mothers had children under 5 years old (22 children: 13 girls and 9 boys) with an average age of 2±1.18 years.
There was no difference between the weight and height of the children of obese mothers and those of overweight and normal-weight mothers. The BMI of children increased according to the nutritional status of the mother without there being a significant difference between groups.
There were no significant differences in the Z-score values for any of the parameters established in the children, considering the nutritional status of their mothers.
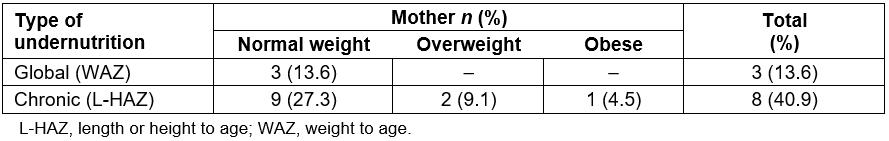
Data additional to the nutritional indicators of children showed malnutrition, especially in the girls, of whom 23% had a low weight (n=3), 46.1% presented problems of short stature and severe short stature (n=6) and 23% were emaciated or severely emaciated.
In the case of children under 3 years of age, 7.6% of the girls were at risk of microcephaly (n=1).
Household food security and the mother’s nutritional status
Regarding food security measured using the food security scale, of the 27 households, 51.9% (14 households) presented mild food insecurity, 14.8% (four households) had moderate food insecurity and 33.3% (nine households) had severe food insecurity. No family had food security in their home.
Figure 2 shows the distribution of the nutritional status of the mothers and the food security of the household. When classifying the mothers according to their nutritional status, it was observed that of the overweight or obese women (n=16), six had severe, three had moderate and seven had mild food insecurity. Mild food insecurity predominated in the group of normal-weight women.
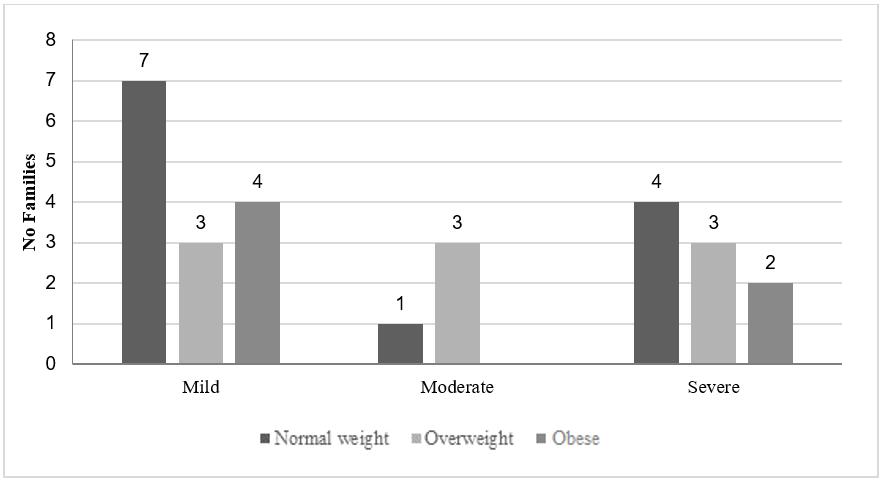 Figure 2: Levels of food insecurity according to mother’s nutritional status.
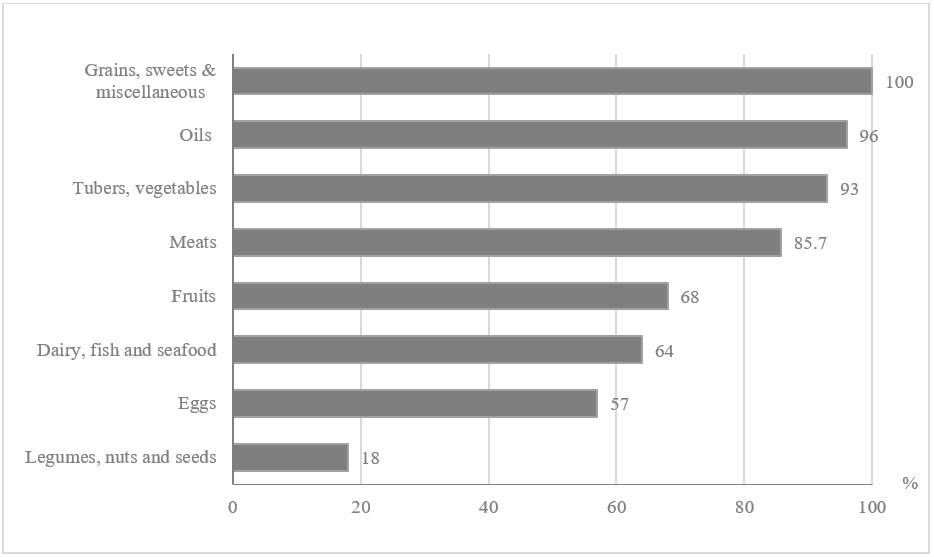 Figure 3: Food groups consumed by the families.