


Introduction
Indonesia is committed to achieving global commitments in line with the UN Sustainable Development Goals (SDGs), which include ensuring the sustainability of people’s livelihoods, development that maintains the quality of the environment and ensures justice, and implementation of governance that can improve quality of life from one generation to the next. One form of Indonesia's commitment related to health issues in the SDGs is integrated into the third goal: ‘Ensure healthy lives and promote well-being for all at all ages’. One of the targets in this goal by 2030 is to reduce under-five mortality and infant mortality1.
The results of the 2017 Indonesian Nursing Diagnosis Standards (based on the Indonesia Demographic and Health Survey) showed a decrease in neonatal mortality rate from 20 per 1000 live births in 2002 to 15 per 1000 live births in 2017. The infant mortality rate decreased from 35 per 1000 live births in 2002 to 24 per 1000 live births in 2017, and the under-five mortality rate from 46 per 1000 live births in 2002 to 32 per 1000 live births in 20172. However, the Indonesian government’s neonatal mortality rate target is less than 10 per 1000 live births and the infant mortality target rate is 16 per 1000 live births, which are expected to be achieved by 2024. Therefore, the targets of such indicators remain to be pursued.
Some research results show that low birth weight (LBW, <2500 g) is the main cause of neonatal death. As a sign of maternal and fetal health and nutrition provided, infants born at an ideal weight are essential. Many factors can cause LBW, such as genetic, demographic, and psychological factors, limited access to medical services (especially obstetrics and antenatal care), lack of nutrition, maternal diseases during pregnancy, and exposure to toxins3,4. Some previous research found neonatal deaths were correlated with the number of prenatal visits being fewer than seven, and the number of pregnancies of less than 37 weeks (premature birth)5. Gaiva concluded neonatal deaths in infants with LBW could be prevented through adequate attention to prenatal, labor, and infant care5. Prenatal care begins during the gestation period of a woman. As for the pregnancy of a woman with four ‘too’ conditions – ‘too young’ (giving birth at the age of less than 21 years), ‘too old’ (giving birth at the age of more than 35 years), ‘too close birth spacing’ (less than 33 months) and ‘too many children’ (more than two children) affects both the health of the mother and the neonate6-12.
Studies in rural India showed significant differences in LBW between rural and urban areas (18.58% v 17.36%) and that women who delivered at home were more likely to have LBW infants13. Other studies also showed that pregnant women with poor nutritional intake are four times more likely to give birth to LBW infants compared to pregnant women with adequate nutritional intake14. Other risks of LBW compared to weights of 2500 g or more include stunting, lower IQ, death in childhood, and risk of obesity, heart disease, and diabetes in adulthood4.
Problem statement
Indonesia strives to realize its global commitment through the third SDG, one of which is reducing neonatal mortality and infant mortality. Although neonatal mortality, infant mortality, and under-five mortality rate documented a downward trend until 2022, a significant policy strategy is still needed to achieve the Indonesian government's target in 2024. LBW, based on the results of the studies cited above, is the main preventable cause of neonatal mortality, infant mortality, and under-five mortality. LBW is also a risk for stunted growth, low IQ, obesity and even death, as well as heart disease and diabetes. Currently, some research analyzes the provincial level and rural–urban differences by using recent data and smoking status. In addition, rural areas in Indonesia have limited access to health and education, and thus pregnant women's knowledge is low and they have limited access to antenatal care. This condition has an impact on the risk of LBW in rural areas. Therefore, in this study, it is important to analyze the profile and determinants of LBW in Indonesia.
Research objective
The general purpose of this study was to determine the profile of LBW and test the factors of LBW in Indonesia. The specific purpose was to determine LBW segmentation based on sociodemographic characteristics in Indonesia and examine the dominant factors of the LBW issue in Indonesia.
Methods
This study analyzed secondary data from the 2021 National Socioeconomic Survey/Survei Sosial Ekonomi Nasional (SUSENAS) conducted in all regions of Indonesia (34 provinces) with representative levels at the district, provincial, and national levels. The sample collected was 345 000 households distributed in 514 districts and cities. The sample criteria in the survey did not include certain households such as official residences and prisons.
Samples framework and design
According to Indonesian Central Statistics/Badan Pusat Statistik (BPS) 2021, the master sampling frame used ranges from 40% of census blocks taken by probability proportional to size with the number of family heads (those responsible for family needs) as a result of the Population Census/Sensus Penduduk 2020 (SP2020) population list summary15. The formation of the survey samples frame was carried out through two stages. In the first stage, the master sample frame amounted to 40% of SP2020 census blocks taken by probability proportional to size. Before the formation of the master sample frame, all SP2020 census block results were stratified according to the classification of residential areas (urban–rural). Census block stratification was carried out to improve the precision and efficiency of the design. Stratification also guarantees the representativeness of samples from each stratum. The second stage contained a sample framework of the list of households registered in each selected census block. Implicit stratification was also carried out in households based on the education level of the head of household (a person responsible for the needs of one or more families). This was done to maintain the representativeness of the value of diversity of household characteristics.
The design of the survey data sample was selected using the two-stage phase stratified sampling method with the following details15:
- Select 40% of the population census block by probability proportional to size with the number of families from the SP2020 population list summarised in each stratum in the district/city. Then, systematically select n number of census blocks according to the allocation in each urban–rural strata per district/city. Accordingly, representative information in rural areas can be obtained through the sampling process15.
- Select 10 households from systematic registration with implicit stratification according to the education of the head of household.
Dependent and predictor variables
The dependent in this study is LBW. Babies with LBW are defined by WHO as babies born with a birth weight of less than 2500 g regardless of gestational age. The predictor variables in this study are residence, education level, smoking status, times without eating healthy and nutritious foods, age at first birth, age at last birth, and birth spacing (reference ≥33 months).
Data collection and analysis technique
SUSENAS 2021 household data were collected using a structured questionnaire conducted by direct interviews between survey officers and respondents. The household information was collected through interviews with the head of household, the spouse of the head of household, or household members who understood the proposed characteristics. Before researchers processed the raw data of SUSENAS 2021, BPS conducted receiving/batching, editing, coding, and simple validation. Complete validation was executed to obtain the final data. Based on the results of cleaning data, the total target of 345 000 households subsided to the final data of 344 148 households. The unit of analysis used in this study was women who were married, with a total of 4 711 455 women (weighted). After applying the birth spacing variable (married women with at least two children), the total unit of analysis was 4 526 400 women. The LBW data were obtained from healthcare facility records (maternal and child health book). The inclusion criterion was women who were married. The exclusion criterion was women who had given birth to fewer than two children.
We performed descriptive statistical analysis by presenting cross-tabulations, and frequency distribution based on sociodemographic characteristics at the city/district level. Logistic regression analysis was applied as inferential analysis to test the significant variables affecting the dependent variable and to figure out the variables that most influence the incidence of LBW in Indonesia. Simple logistic regression was used to analyze without control variables and multiple logistic regression was used to analyze independent and dependent variables simultaneously (after controlling other variables).
Descriptions related to coefficients in logistic regression models were outlined in the form of odds ratios or adjusted probability16. Odds ratio is defined as p = P ÷ (1 – P) (risk), where p expresses the probability of success (occurrence of the event y=1) and (1 – P) expresses the probability of failure (y=0). In this study, the odds ratio was used to find out which variables affect the number of children born with low weight.
We used list-wise deletion or univariable and multivariable analysis for missing data. The multicollinearity test was assessed by a correlation matrix among the predictors in this study. The test showed correlation coefficients among independent variables were less than 0.90, which meant that the assumption of multicollinearity was met17.
Results
Based on the results of the SUSENAS 2021 data analysis, the province North Maluku had the highest LBW rate of 20.1%, followed by Central Sulawesi (17%), and Banten (16%). The province with the lowest LBW prevalence was Central Java (8.3%) and provinces with LBW prevalence below 10% were Riau (9.3%) and Central Java (8.3%). Nationally, the prevalence of LBW in Indonesia was 11.7%. In conclusion, 19 provinces had LBW rates above the national average, and the prime focuses are large provinces such as DKI Jakarta (11.9%), East Java (12%), and DI Yogyakarta (12%), which have LBW prevalence rates above the national prevalence rate. Most provinces with high LBW prevalence are in the Central and Eastern provinces of Indonesia such as North Maluku (20.1%), Central Sulawesi (17%), South Sulawesi (15.4%), West Sulawesi (15.2%), East Nusa Tenggara (14%), West Papua (13.9%), Gorontalo (13.3%), Southeast Sulawesi (13%), Papua (12.7%), and Maluku (12.5%).
In addition to these LBW prevalences, the national percentage of women who gave birth to children who were not weighed was 2.4%. As seen in Figure 1, most provinces with high prevalences of infants not weighed at birth are in the Eastern Province of Indonesia, such as Papua (22.1%), Maluku (17.4%), West Papua (11.5%), East Nusa Tenggara (9.9%) and North Maluku (8.6%). The high percentage of infants that were not weighed in the Eastern Province of Indonesia is likely due to the lack of supporting health facilities and infrastructure, and geographical conditions making it difficult for people to access health services. Thus, the prevalence of LBW may not be the highest in North Maluku, but in the province with the highest percentage of infants who are not weighed at birth by their parents. This is due to the large percentage of children who were not weighed in Papua, West Papua, Maluku and East Nusa Tenggara. Moreover, when the survey was conducted, the percentages of women who answered that they did not know the weight of their children at birth were highest in Papua (12.6%), West Papua (8.3%), and North Maluku (7.4%).
The percentage of LBW by provinces in Figure 1 shows that there is still a disparity in the percentage of LBW in numerous provinces in Indonesia. Interestingly, based on the absolute number of LBW, West Java is the province with the highest number of LBW infants in Indonesia, with 104 585 infants weighing less than 2.5 kg. The next provinces with a high LBW are East Java with 58 809 infants and Central Java with 41 074 infants. Although these three provinces do not have the highest prevalence of LBW in absolute terms, the infants with the most LBW are within the three provinces. This is because Java Island is the most populous province in Indonesia.
Banten, with a total LBW of 38 213 infants, ranks fourth compared to other provinces nationally. While Banten is not the province with the largest population, it has the third-highest LBW percentage and is the province with the fourth-highest absolute number of LBW infants in Indonesia. The absolute number of LBW by province is essential as it acts as a map and priority for handling LBW because it has the most influence on the contribution of the national LBW rate, which is 552 787 infants (Fig 2).
After calculating the prevalence of LBW and the absolute amount of LBW infants in each province, further analysis (Table 1) obtained profiles of women with infants born under 2.5 kg commonly found in villages (12.9%), with low education (did not complete elementary school 13.4%, completed elementary school/equivalent 12.9%), smoking behavior (16.7%), consuming non-nutritious foods (13.6%), giving birth at an age less than 21 years (11.8%), giving birth at an age of more than 35 years (13.3%), and birth spacing less than 33 months (12%). The Indonesian government, through relevant ministries/institutions, may prioritize the handling of LBW in communities with this profile. Identical data were perceived as applying to women with unweighed infants and who answered they did not know about the weight of their baby at birth.
Table 2 presents the results of an inferential test to determine the most influential variables on LBW events in Indonesia. There were two types of test in the analysis: using a crude odds ratio (OR) (without being controlled by other variables) and using an adjusted OR (testing after being controlled by other variables). Based on the test results, the smoking variable was the most influential variable on the incidence of LBW, even though the variable exceeds the variables of consuming nutritious food (OR 1.20), giving birth at an older age (OR 1.89), living in a village (OR 1.25) and having low education (OR 1.07). Pregnant women who had smoking behaviors every day were 1.61 times more likely to give birth to LBW infants than pregnant women who did not have smoking behaviors. Even after controlling for other variables, smoking variables still had the most influence on the incidence of LBW. Women with smoking behaviors were 1.45 times more likely to give birth to LBW infants compared to women who did not smoke. The results of the inferential test showed the variable of smoking behavior to be the variable that most affects the incidence of LBW.
The inferential test was also conducted by including other variables in the calculation and after the testing. Variables including residence, education level, not consuming healthy food, childbirth age over 35 years and birth spacing below 33 months significantly affected the incidence of LBW even after being controlled by other variables. In rural Indonesia, infants tended to have low LBW (adjusted OR: 1.249; 95%CI: 1.241–1.256). The prevalence of LBW in rural areas was higher than in urban areas (12.9% vs 10.8%) in Indonesia. These results show that interventions to reduce LBW can be prevented by prioritizing these variables. Level of education describes a person's knowledge, therefore, low education is a significant variable affecting LBW, and knowledge about behaviors that may result in LBW events can also be considered to be minimal. Therefore, central governments and local governments need to improve parents’ knowledge about healthy and nutritious foods, especially for mothers in rural areas.
Table 1: Maternal profile for low birth weight infants in Indonesia, 2021
| Characteristic | Weighing response (%) | ||||
|---|---|---|---|---|---|
| <2.5 kg | ≥2.5 kg | Not weighed | Do not know | ||
| Residence | |||||
| Urban | 10.8 | 86.7 | 1.3 | 1.1 | |
| Rural | 12.9† | 81.2 | 3.7 | 2.1 | |
| Highest education | |||||
| Not completed elementary school | 13.4† | 76.5 | 6.3 | 3.8 | |
| Elementary school | 12.9 | 81.5 | 3.8 | 1.8 | |
| Junior high school | 11.1 | 85.6 | 1.9 | 1.4 | |
| Senior high school | 12.0 | 85.4 | 1.4 | 1.2 | |
| Diploma | 8.7 | 89.8 | 0.5 | 0.9 | |
| Bachelor's degree | 10.4 | 87.7 | 0.8 | 1.1 | |
| Postgraduate | 3.2 | 96.8 | 0.0 | 0.0 | |
| Smoking | |||||
| Yes, every day | 16.7† | 75.1 | 5.8 | 2.3 | |
| Yes, not every day | 4.9 | 80.4 | 6.9 | 7.8 | |
| Do not smoke | 11.7 | 84.5 | 2.3 | 1.5 | |
| Do not know | 2.7 | 92.0 | 1.9 | 3.4 | |
| Times when cannot eat healthy and nutritious foods | |||||
| Yes | 13.6† | 79.6 | 4.7 | 2.2 | |
| No | 11.5 | 84.9 | 2.1 | 1.5 | |
| Do not know | 7.0 | 88.0 | 3.3 | 1.8 | |
| Decline to answer | 23.4† | 55.7 | 16.6 | 4.3 | |
| Age at first birth (years) | |||||
| ≥21 | 11.7 | 84.7 | 2.2 | 1.5 | |
| <21 | 11.8† | 83.7 | 2.8 | 1.7 | |
| Age at last birth (years) | |||||
| ≤35 | 11.3 | 84.8 | 2.4 | 1.5 | |
| >35 | 13.3† | 82.6 | 2.3 | 1.8 | |
| Birth spacing (months) | |||||
| ≥33 | 11.7 | 84.6 | 2.1 | 1.5 | |
| <33 | 12.0† | 82.3 | 3.9 | 1.8 | |
† Higher/highest prevalence for the relevant variable. Source: Data processed from National Socio-Economic Survey/Survei Sosial Ekonomi Nasional (SUSENAS) 2021.
Table 2: Inferential analysis results of determinants of low birth weight in Indonesia
| Variable | Multiple analysis | Simple analysis | |||||||
|---|---|---|---|---|---|---|---|---|---|
| Sig. | Adjusted OR | 95%CI | Sig. | Crude OR | 95%CI | ||||
| Lower | Upper | Lower | Upper | ||||||
| Residence | |||||||||
| Urban (ref.) | |||||||||
| Rural | 0.000 | 1.249† | 1.241 | 1.256 | 0.000 | 1.274† | 1.267 | 1.282 | |
| Education level | |||||||||
| Elementary (ref.) | 0.000 | 1.000 | 0.000 | 1.000 | |||||
| Not completed elementary school | 0.000 | 1.071† | 1.056 | 1.086 | 0.000 | 1.111† | 1.096 | 1.127 | |
| Junior high school | 0.000 | 0.865 | 0.858 | 0.872 | 0.000 | 0.822 | 0.815 | 0.828 | |
| Senior high school | 0.000 | 0.946 | 0.939 | 0.954 | 0.000 | 0.887 | 0.881 | 0.894 | |
| Diploma | 0.000 | 0.677 | 0.665 | 0.690 | 0.000 | 0.616 | 0.605 | 0.628 | |
| Bachelor's degree | 0.000 | 0.817 | 0.808 | 0.827 | 0.000 | 0.753 | 0.745 | 0.762 | |
| Postgraduate | 0.000 | 0.237 | 0.216 | 0.261 | 0.000 | 0.208 | 0.189 | 0.229 | |
| Smoking | |||||||||
| Do not smoke (ref.) | 0.000 | 0.000 | |||||||
| Yes, every day | 0.000 | 1.451† | 1.395 | 1.509 | 0.000 | 1.611† | 1.551 | 1.674 | |
| Yes, not every day | 0.000 | 0.419 | 0.367 | 0.478 | 0.000 | 0.437 | 0.383 | 0.498 | |
| Do not know | 0.000 | 0.186 | 0.125 | 0.276 | 0.000 | 0.214 | 0.144 | 0.318 | |
| Times when cannot eat healthy and nutritious foods | |||||||||
| No (ref.) | 0.000 | 0.000 | |||||||
| Yes | 0.000 | 1.201† | 1.190 | 1.212 | 0.000 | 1.257† | 1.246 | 1.268 | |
| Do not know | 0.000 | 0.853 | 0.813 | 0.894 | 0.000 | 0.842 | 0.803 | 0.883 | |
|
Age at first birth (ref. <21 years) |
0.242 | 1.004† | 0.997 | 1.010 | 0.000 | 0.976 | 0.970 | 0.982 | |
|
Age at last birth (ref. >35 years) |
0.000 | 1.186† | 1.178 | 1.195 | 0.000 | 1.205† | 1.197 | 1.213 | |
|
Birth spacing (ref. <33 months) |
0.000 | 1.127† | 1.117 | 1.137 | 0.000 | 1.053† | 1.044 | 1.062 | |
† Higher/highest OR for the relevant variable. CI, confidence interval. OR, odds ratio. Ref, reference variable. Sig., significance. Source: Data processed from National Socio-Economic Survey/Survei Sosial Ekonomi Nasional (SUSENAS) 2021.
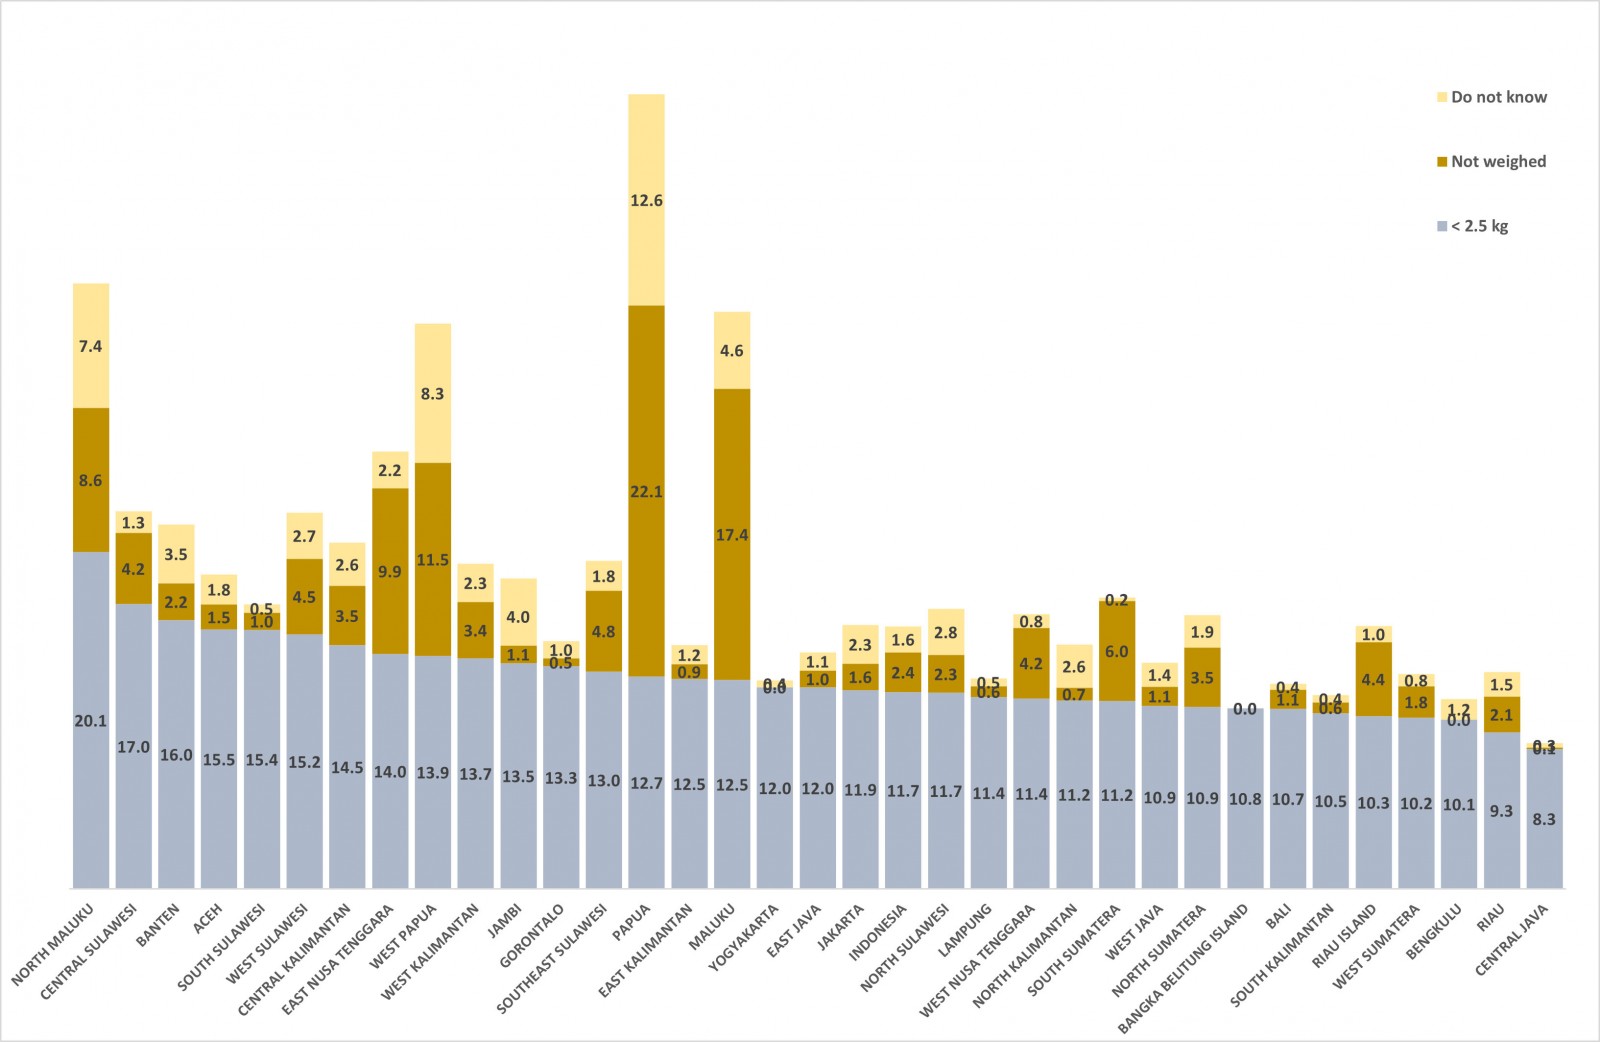 Figure 1: Prevalence (%) of low birth weight by Indonesian province, 2021. Source: Data processed from National Socio-Economic Survey/Survei Sosial Ekonomi Nasional (SUSENAS) 2021
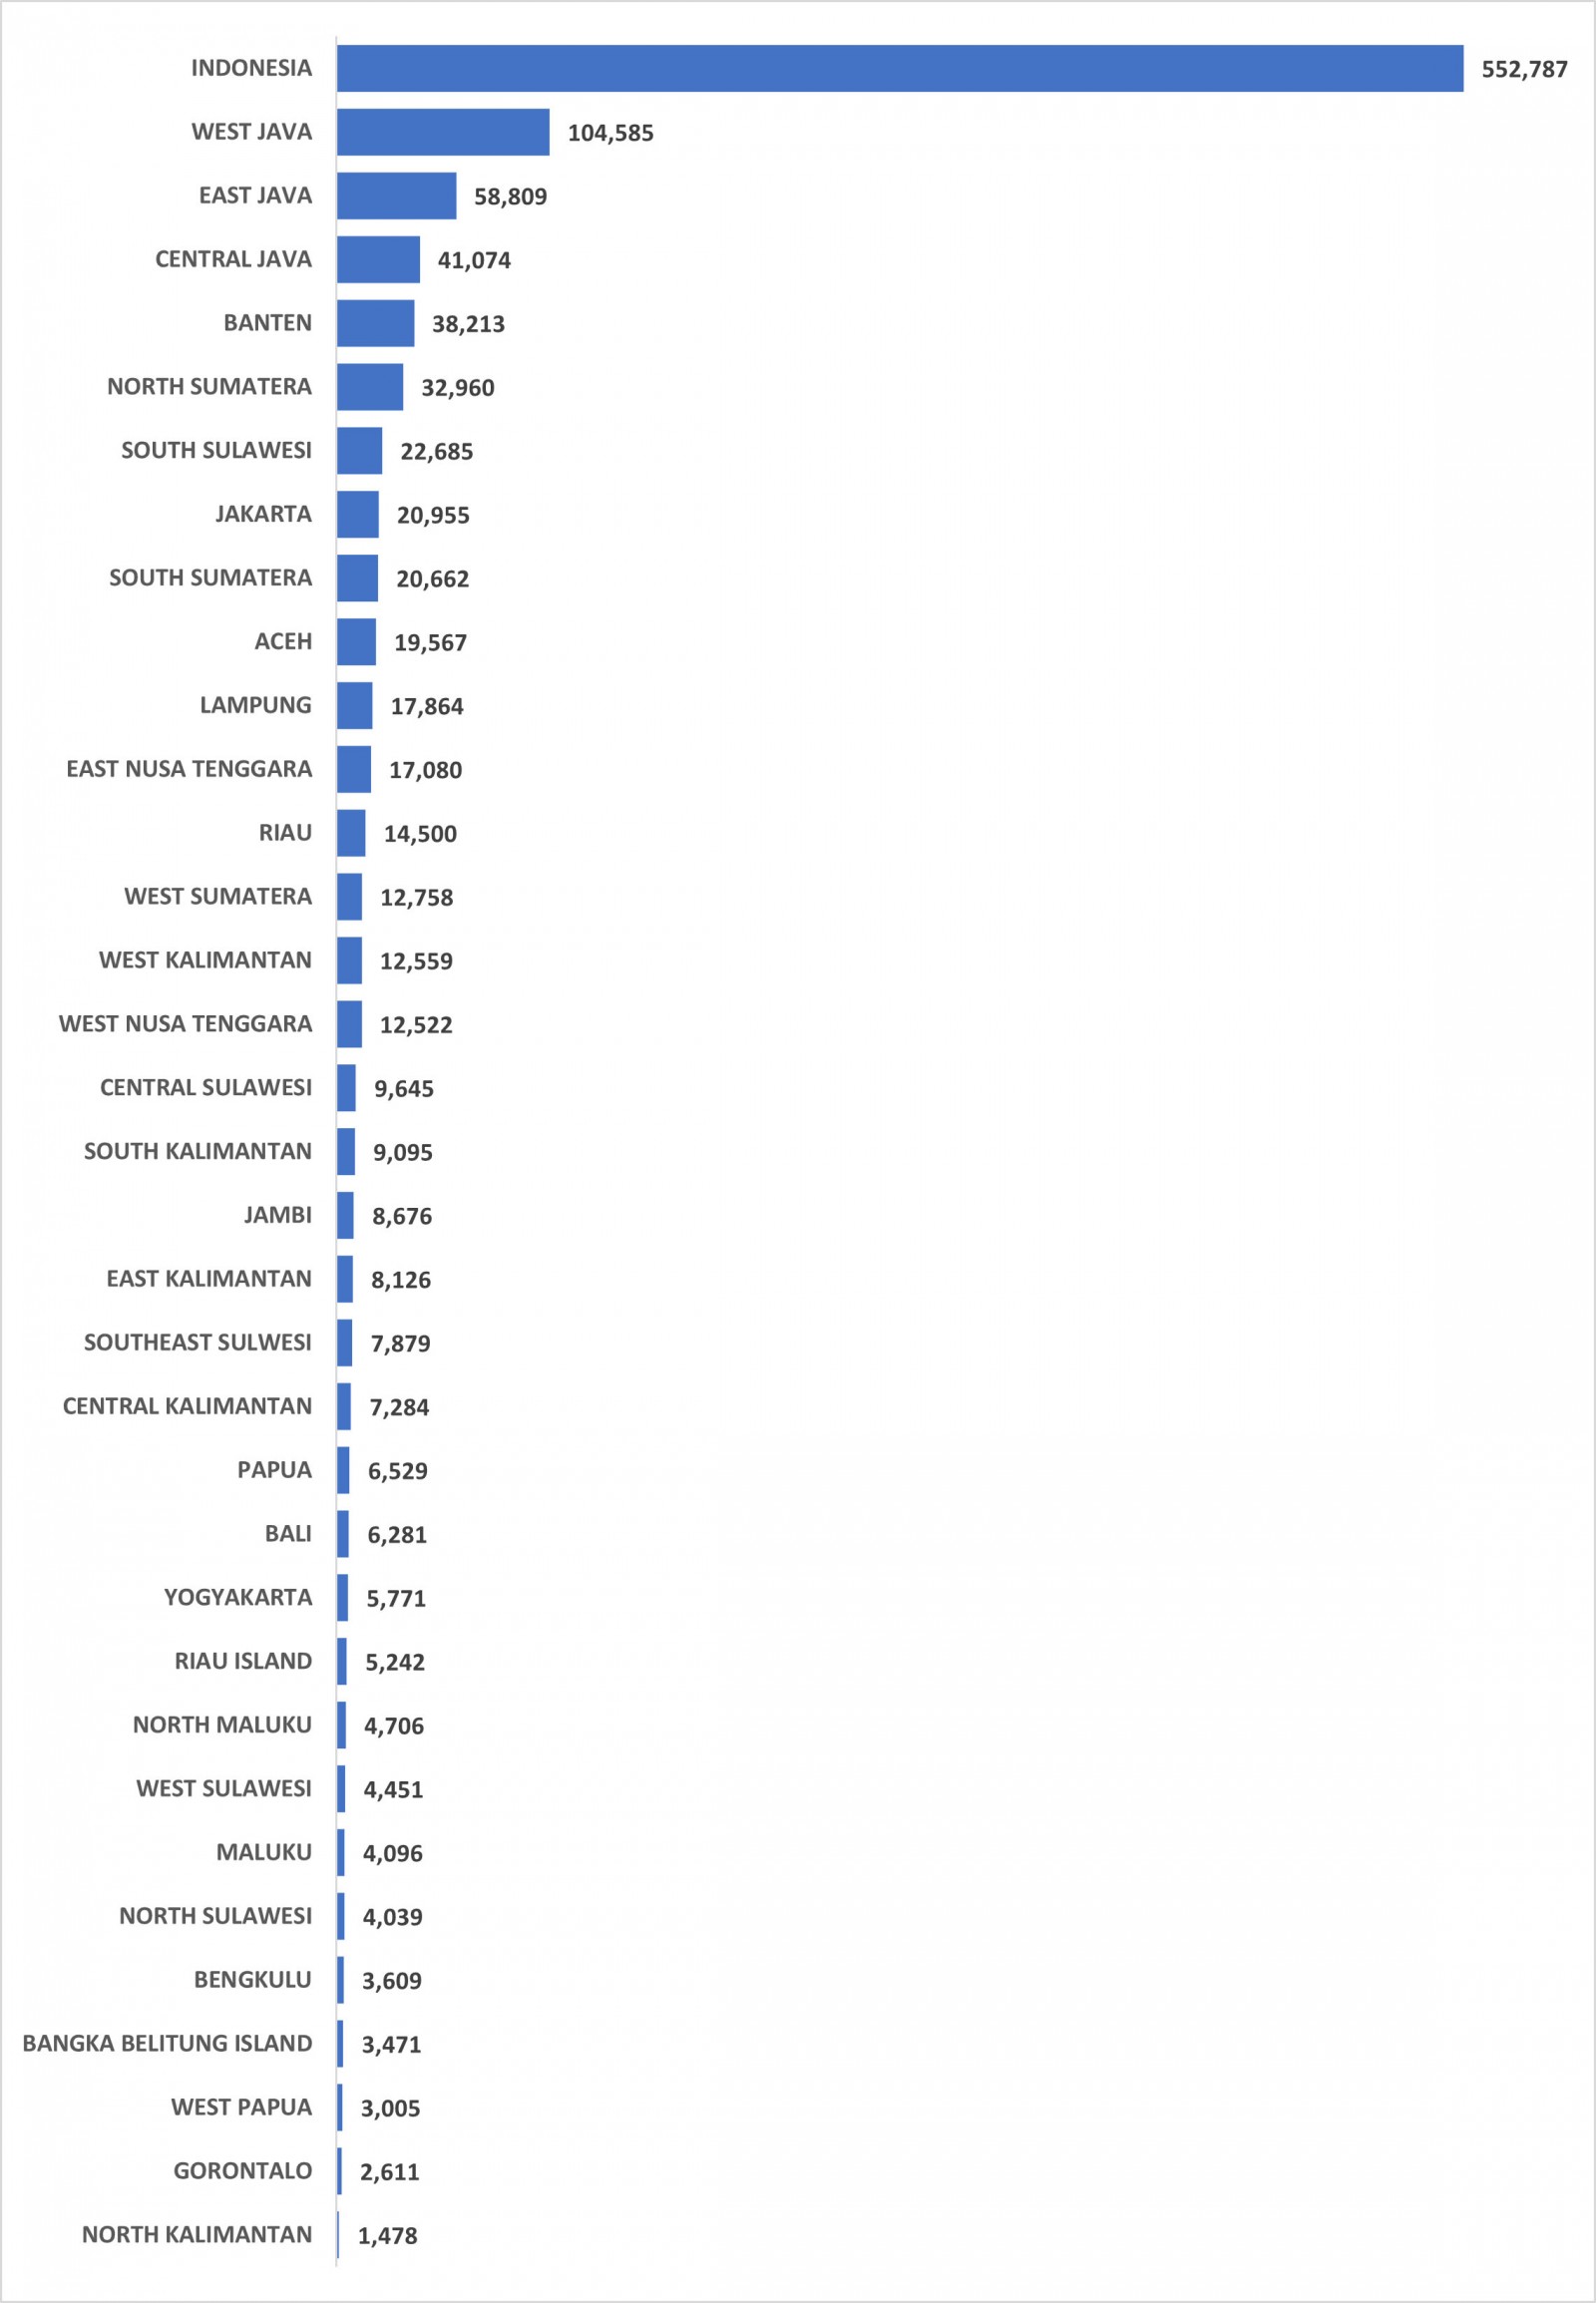 Figure 2: Low birth weight numbers (absolute) by Indonesian province, 2021. Source: Data processed from National Socio-Economic Survey/Survei Sosial Ekonomi Nasional (SUSENAS) 2021
Discussion
The incidence of LBW is determined by several factors such as malnutrition, low education, close birth spacing, giving birth at a young age and giving birth over the age of 35 years. This finding is also substantiated by a previous study which concluded that in rural areas of Uganda there was severe food insecurity, teenage pregnancy, short birth spacing, malaria infection, non-optimal non-antenatal care and home births10. Studies in Indonesia also showed that the phenomenon of adolescent birth is more common in rural areas18. In addition, Malaysian rural women tend to give birth to LBW infants compared to births by women living in urban areas19,20. In the latter of those two studies, Woldeamanuel et al focused on malnutrition experienced by women living in rural areas and malnutrition in pregnant women resulting in infants born with LBW20. Studies in Indonesia have shown that low education has a strong effect on the occurrence of LBW infants in mothers with four ‘too’ conditions21. The results of that study showed that parents' education level affects parenting. The higher the level of the parents’ education, the better parenting that can be provided to children. This can prevent risky behavior in adolescents, early marriage, teenage pregnancy and LBW infants22.
Previous research has shown that people living in rural areas generally have lower education and lower economic status23,24. Some of these are factors in women giving birth, giving birth at an age that is relatively old or young, with short birth spacing and to too many children. Other studies have found that teenage marriage due to sexual intercourse from an early age may result in LBW18.
This can be addressed by using modern and suitable female contraceptives and raising awareness of modern contraceptives. Previous research found that women with National Health Insurance/Jaminan Kesehatan Nasional (JKN) were 17.04 times more likely to use modern contraception than women who did not have JKN. Women who had JKN with non-contribution/non-Penerima Bantuan Iuran (non-PBI) and contribution/PBI criteria are associated with a greater tendency to use contraception, by 1.14 times and 1.01 times respectively, than women who did not have JKN25,26. Women who have low private health insurance tend to use modern contraception less than women who do not have health insurance. This indicates that an important role of government is ensuring that every woman gets health insurance by expanding JKN coverage to remote areas or rural areas with limited access conditions and facilities, hence enabling them to use modern contraception according to their needs.
Findings in other studies showed that smoking behavior in women is a major factor influencing birth weight. Several other studies have found that smoking behavior is a major factor influencing LBW: mothers with smoking behavior have a 2.46 times higher potential of LBW infants than mothers who do not smoke. Research conducted at Nepal Hospital showed that women who smoked during pregnancy were 10 times more likely to give birth to LBW infants compared to women who did not smoke during their pregnancy27,28. The results of these analyses and studies and the prevalence of smoking in the population over the age of 14 years in Indonesia since 2020, 2021 and 2022 showed consistent percentages of 28.69%, 28.96% and 28.26%, respectively. This implies that the absolute number of the Indonesian population who smoke is 58 682 626 people. West Nusa Tenggara is the province with the highest smoking prevalence of 33.2%, or 1 766 271 people15,29. Based on SUSENAS 2021 the percentage of marriage is 62.73%, meaning that there are 46 461 763 people in married couples of childbearing age (15–49) years, and 79.17% of these couples have the potential to smoke15.
Conclusion
Based on the results of the determinant analysis that explains the profile of LBW in Indonesia in 2021, it can be first concluded that North Maluku (20.1%), Central Sulawesi (17%) and Banten (16%) are the top three provinces with high LBW rates in Indonesia. Second, the highest numbers of LBW are in the provinces of West Java, East Java, Central Java, Banten and North Sumatra. Third, factors associated with LBW are smoking status, non-nutritious foods, residence, level of education, and four ‘too’ conditions: ‘too young childbirth age’, ‘too old childbirth age’, ‘too short birth spacing’ and ‘too many children’. Smoking status was a dominant factor influencing LBW, and women with smoking behavior were 1.45 times more likely to give birth to LBW infants than non-smokers. Non-nutritious foods have been shown to significantly increase the incidence of LBW. Women who live in villages were 1.25 times more likely to give birth to LBW infants than women in cities. Women with low levels of education tended to give birth to LBW infants. The four ‘too’ conditions are shown to be factors in LBW events.
Recommendation
As a recommendation from this study, the government should prioritize provinces with the highest absolute numbers and the highest percentages of LBW for the prevention and handling of LBW in Indonesia. Stakeholders should implement regulations about smoke-free areas. The provincial and district government could provide education through a campaign to use appropriate contraceptives and use the slogan 4T (no ‘too young childbirth age’, no ‘too old childbirth age’, no ‘too short birth spacing’ and no ‘too many children’) as prevention of LBW childbirth. There should also be assistance to families by prioritizing the profile of LBW (living in a village/rural area, low education, smoking behavior, not or rarely consuming nutritious food and included in the 4T criteria). The central government needs to strengthen compulsory education programs (12 years) and give scholarships for rural areas to increase higher education until university. The central governments and local governments need to improve access to healthcare facilities such as anthropometry tools, health workers and healthcare services, and improve parents’ knowledge about healthy and nutritious foods, especially for mothers in rural areas. The central governments and local governments also need to optimize the maturity of the marriage age that is necessary to prevent child marriage (marriage at age <19 years).